Levels of Organization Energy Flow/Cycles Climate Aquatic Ecosystems Population Growth
Limits to Growth Fishery Data Human Influence (see our Plastic Pollution Project)
Limits to Growth Fishery Data Human Influence (see our Plastic Pollution Project)


 Freshman Plastic Pollution Survey
Lil Mermaid Plastic Pollution song
Human Influence (Plastic Pollution Project Spring 2015)
Group project calendar
Identify 5 Human Impacts on Ecosystems
Task 1: Make a student Pre/Post-survey
Critique another teams survey questions.
Seafood Survey
Home Energy Use
Plastics (Plastics Use Audit)
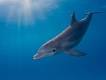
Leopard Sharks
Water Conservation??
Transportation
Watch: Conservation and Restoration Ecology.
Plastic Pollution Prezi & video by Kane Garcia
by Bianca Bautista, Ramya Chandrasekaran, Marcos Avina & Christopher Wong
Activity: Plastics And Marine Animals
Task 2: Action plan (ex. Plastic Action Plan) & Audience(s)
Student tasks, the data & graphs
From pre-survey data, we want to focus on:
1. Littering on campus (Chemistry in the community)
2. Reducing overall plastic use through school-wide education
campaigns (All science classes).
3. Re-usable coffee cups/water bottles (Environmental club).
Task 3: Data Analysis, Spreadsheets and Graphs
1. School-wide Plastic Trash Use Audit / Data and Graphs
2. Track our water bottles sold/used & students bringing re-usable bottles.
Task 4: Presentations, Follow-up analysis & Final Exam (7% increase after going through the project, the data.)
1. Changes made: Campaigns, Recycling & Water Bottle sales.
2. Short term results-data compiled end of March & long term (end of year surveys & trash audit)
3. Creek water analysis, change in flora & fauna.
GET INVoLVED!!
Join the Environmental Club to learn more about how to enter into the Plastic Pollution Prevention competition. You will present your final findings to scientists & teachers at the Monterey summit in April.
Human Influence (Plastic Pollution Project Spring 2015)
Group project calendar
Identify 5 Human Impacts on Ecosystems
Task 1: Make a student Pre/Post-survey
Critique another teams survey questions.
Seafood Survey
Home Energy Use
Plastics (Plastics Use Audit)
Leopard Sharks
Water Conservation??
Transportation
Watch: Conservation and Restoration Ecology.
Plastic Pollution Prezi & video by Kane Garcia
by Bianca Bautista, Ramya Chandrasekaran, Marcos Avina & Christopher Wong
Activity: Plastics And Marine Animals
Task 2: Action plan (ex. Plastic Action Plan) & Audience(s)
Student tasks, the data & graphs
From pre-survey data, we want to focus on:
1. Littering on campus (Chemistry in the community)
2. Reducing overall plastic use through school-wide education
campaigns (All science classes).
3. Re-usable coffee cups/water bottles (Environmental club).
Task 3: Data Analysis, Spreadsheets and Graphs
1. School-wide Plastic Trash Use Audit / Data and Graphs
2. Track our water bottles sold/used & students bringing re-usable bottles.
Task 4: Presentations, Follow-up analysis & Final Exam (7% increase after going through the project, the data.)
1. Changes made: Campaigns, Recycling & Water Bottle sales.
2. Short term results-data compiled end of March & long term (end of year surveys & trash audit)
3. Creek water analysis, change in flora & fauna.
GET INVoLVED!!
Join the Environmental Club to learn more about how to enter into the Plastic Pollution Prevention competition. You will present your final findings to scientists & teachers at the Monterey summit in April.

Levels of Organization ex. Open Ocean

| activity-hierarchyoflife.docx |


terms: ecosystem individual biosphere community population biome
Practice: Use the pictures above to write a one sentence definition for two of the terms.
Check-in with your partner to refine your definitions.
Use your picture handouts to see if you can put the levels in order from simple to complex.
Levels of Organization WS
Marine Biomes: Shorelines PPT/Notes vs. Land Biomes
(focus on Estuaries, Salt Marshes, Mangrove Forests & Mudflats)
Lesson: Marine Ecosystems-Identifying Organism Roles
ex. Wetland Biodiversity
Assessment-Ecosystems
Team Activity: Skim through the Coastal Wetlands Background Information.
1. Underline three main consumers, the main producer and the decomposer.
2. Circle three human influences on wetlands and underline their effects.
3. Fill in the Coastal Wetland food web cards using your notes, the Coastal Wetlands reading and the Monterey Bay Aquarium's: Sandy shore & Aviary link.
4. Work in groups to create the food web.
5. Fill in your Ecosystem Role Chart for wetlands only.
6. Discuss Human Impact Reading: Allied Grains Rice Farm Expansion
Correct the Assessments
-Prepare for the Ecology Exam. Essay Prompt
| quiz-ecology.html |
Energy Flow


Biomass and energy flow Food chains, webs & cycles Energy & chemical sources & sinks Trophic levels & Organism Roles
-
Watch Khan Academy's Crash course in Ecology, Ecosystem Ecology:
Take notes and focus on the three main ideas shown above.
Practice:
1. List the producers, consumers and trophic levels in the first picture.
2. How many food chains can you identify in the second picture?
3. Follow one of these food chains and identify each level, be specific in naming the organism in your trophic levels.
Example: 1. Phytoplankton are first level primary producers. 2. Herbivorous zooplankton are primary consumers. 3. Squid are secondary consumers. 4. The elephant seal is the tertiary consumer. 5. The killer whale is the top or quaternary consumer.
4. Describe the energy source and sink(s) in a marine ecosystem you see in the last picture.
Marine Biomes: Tropical Oceans PPT/Notes vs Land Biomes
Begin identifying and coloring in the marine biomes.
Lesson: Ecosystem Comparisons & Energy Flow
Assessment-Energy Flow
Team Activity: Skim through the reading: Great Barrier Reef Case Study.
1. Underline three main consumers, a producer and the key consumer in this reading.
2. Circle three human and three natural influences on the Barrier Reef and underline their effects. Fill in the Effects on Reefs Chart.
3. Fill in your food web cards for Tropical Reefs and create a food web. You can also use information from the National Oceanographic and Atmospheric Association, NOAA's, site on coral reefs:
4. Start the Food Pyramid Worksheet. (Provide answers for coral reefs one side and for wetlands on the other.)
5. Use the Biome Comparison Worksheet to compare your work from wetlands with coral reefs.
Correct Assessments
HW:
-Add in coral reef information to the Ecosystem Chart you started in the previous lesson.
-Complete the Food Pyramid and Biome Comparison Worksheets.
-Answer questions on human effects.
| notes_3-graphic_organizer.pdf |


Population Growth
Practice: Describe two types of population growth. Which type would you choose for a population we have studied so far? Why?
(Populations: Crown-of-thorns sea star, Acanthaster planci, the California sea otter, Enhydra lutris, and the open ocean moon jelly, Aurelia labiata)
Lesson: Managing Marine populations; Sardine & Kelp Fisheries
Team Activity: Read Packed Like a Can of Sardines_.
1. Circle three natural and three human influences on the sardine and kelp populations and underline their effects.
2. Fill in the Sardine Industry Timeline, be ready to share with the class.
3. Make an advertisement for a Marine population. Describe the values of your population and important steps we need to take to protect it. Use the Monterey Bay Aquarium's Seafood Watch as a resource.
Correct assessments
HW:
-Make a diagram for each of the three populations studied in class. Be sure to identify the density dependent and independent factors.
-Complete the Sardine & Kelp Population WS 1 & 2.
Oceans and Climate :


HW: Watch Khan Academy's Crash Course: Ecology, Hydrologic and Carbon Cycles:
Note guide:
1. List the four main chemical cycles.
2. Diagram and describe the water and carbon cycle.
3. How do living organisms participate in the water cycle? carbon cycle?
4. What are three major holding reservoirs for carbon? living plant matter, dead land plants/animals and ocean plants/animals
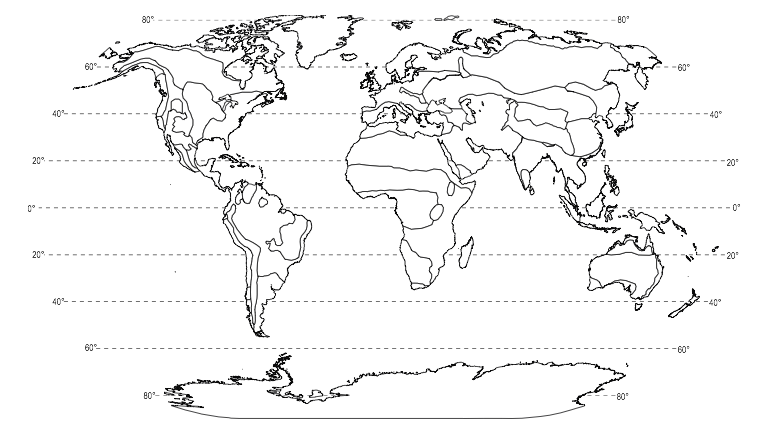
Warm-up: What are four abiotic factors affecting marine ecosystems? Match the map shown above to the factor.
Then, find and describe one of these factors using the world ocean atlas (WOA) link.
Lesson: Determining Ocean Circulation using Satellite Data
Assessment: Properties of Oceans
Atmospheric & Oceanic Circulation & Latitude PPT/Notes
Jetty basic overview
Read your Ocean Circulation Case Study & answer breakwater and jetty questions.
or focus on the Arctic Narwhal activity.
HW:
-Copy the Productivity Table on p 111 & complete problems 2-4.
-Complete the Ocean & Air Circulation worksheet.
Ocean Current Fill-in Map: 1. Line up your maps using the latitude/longitude readings.
2. Color the isotherms on your blank map according to your line-up.
3. Check in with another team and switch color maps to color in both hemispheres on your map.
4. Describe the patterns that you see and be ready to share.
5. Find your ocean of interest and factor of interest using the World Ocean Atlas (WOA) data sets and the Sea Surface Temperatures (SST) links:
Alternate lesson: Microbes & Climate
Lab- Factors Affecting Ocean Circulation (add in salinity & CO2 (acidity))
procedure Ocean Circulation Lab
HW: Use these climatographs to describe the three climate systems in your Ecosystem Comparisons Chart.
-Answer the follow-up questions and be sure to explain why you chose a climatograph for each system.
-Prepare for Major Ocean Currents Quiz by using this link:
Note guide:
1. List the four main chemical cycles.
2. Diagram and describe the water and carbon cycle.
3. How do living organisms participate in the water cycle? carbon cycle?
4. What are three major holding reservoirs for carbon? living plant matter, dead land plants/animals and ocean plants/animals
Warm-up: What are four abiotic factors affecting marine ecosystems? Match the map shown above to the factor.
Then, find and describe one of these factors using the world ocean atlas (WOA) link.
Lesson: Determining Ocean Circulation using Satellite Data
Assessment: Properties of Oceans
Atmospheric & Oceanic Circulation & Latitude PPT/Notes
Jetty basic overview
Read your Ocean Circulation Case Study & answer breakwater and jetty questions.
or focus on the Arctic Narwhal activity.
HW:
-Copy the Productivity Table on p 111 & complete problems 2-4.
-Complete the Ocean & Air Circulation worksheet.
Ocean Current Fill-in Map: 1. Line up your maps using the latitude/longitude readings.
2. Color the isotherms on your blank map according to your line-up.
3. Check in with another team and switch color maps to color in both hemispheres on your map.
4. Describe the patterns that you see and be ready to share.
5. Find your ocean of interest and factor of interest using the World Ocean Atlas (WOA) data sets and the Sea Surface Temperatures (SST) links:
Alternate lesson: Microbes & Climate
Lab- Factors Affecting Ocean Circulation (add in salinity & CO2 (acidity))
procedure Ocean Circulation Lab
HW: Use these climatographs to describe the three climate systems in your Ecosystem Comparisons Chart.
-Answer the follow-up questions and be sure to explain why you chose a climatograph for each system.
-Prepare for Major Ocean Currents Quiz by using this link:
Aquatic Ecosystems


open ocean kelp forest salt marsh coral reefs deep sea
Warm-up: Identify the marine systems shown above. Give two identifying abiotic and three biotic factors for each system.
Marine Biomes: Temperate Oceans PPT/Notes vs Land Biomes
1. Fill in the Marine Zone Worksheet with at least two creatures from each zone. For additional creatures, visit the Monterey Bay's Animal Guide.
Lesson: Ecosystem Comparisons; Humans & Otters
Assessment-Survival Factors in Ecosystems and II
Team Activity: Read A Second Chance for Sea Otters.
1. Underline the main adaptations sea otters have 8fihelp them survive in the kelp forest & highlight the definition for keystone species.
2. Circle three human and three natural influences on the sea otters and underline their effects. Fill in the Human influence on Otters Chart. (substitute the wolverines with otters)
3. Fill in your food web cards for Temperate Oceans and sketch a food web.
Again, use the Monterey Bay Aquarium's Animal Guide and Monterey Bay's Kelp Forest links.
Correct assessments
Lab-Comparing Marine Biodiversity
Warm-up: Identify the parts of a lab report and the steps of the scientific method. How are these processes similar/different.
In this lab, you will receive Diversity Comparison Data from two observations from two marine systems to compare. You will need to work backwards to fill in the parts of your lab report.
Now, write a conclusion about the Factors Affecting Biodiversity.
Materials: Tropical ocean food web cards, open sea biome pictures to make web cards, maps, biodiversity comparison data, PPT notes on marine systems, Monterey Aquarium & NOAA coral reef sites
To make open ocean cards, use Monterey Aquarium's Open Sea exhibit link.
HW
-Add one more marine ecosystem to your Ecosystem Comparisons Chart.
|
| ||||||||
|
| ||||
| essay-oceancircanimaldistribution.pdf |
